Catch problems
before they get
expensive.
Frank monitors every metric every week. When something moves outside its normal range, you hear about it immediately — with context, not just a number.
No credit card required
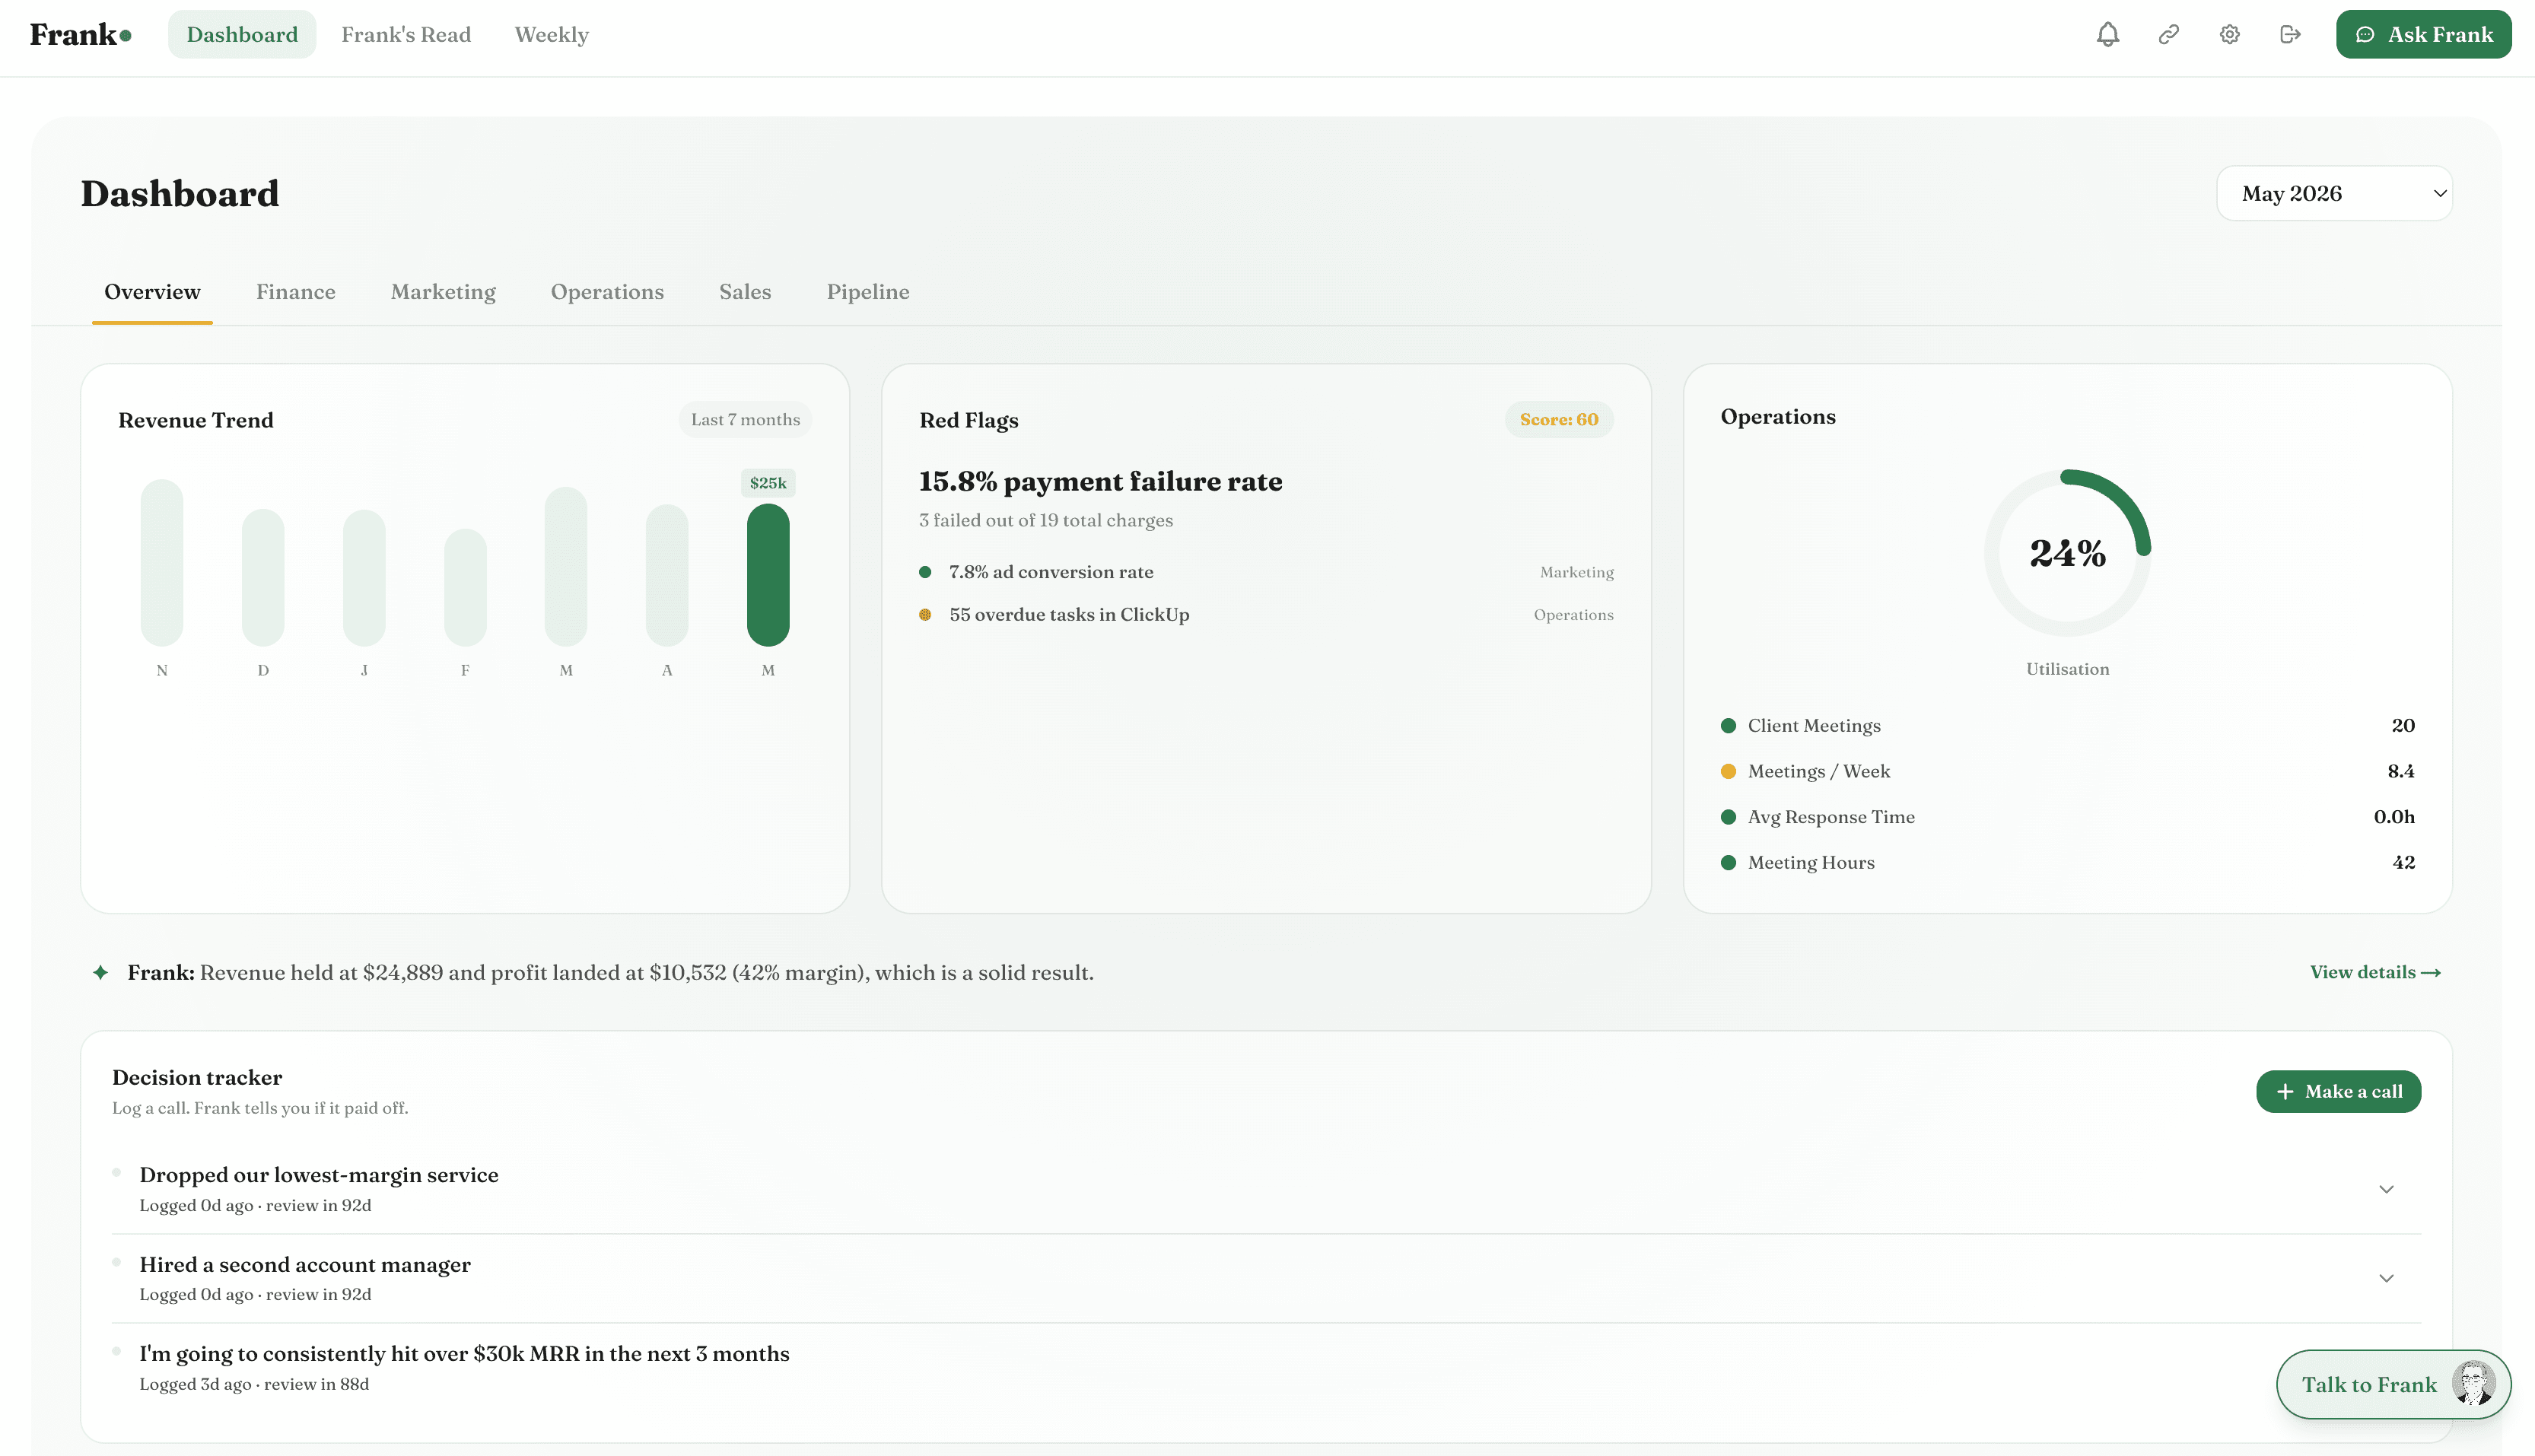
Red flags
Frank found 3 things worth your attention
Cash runway dropped to 28 days
CriticalDown from your 45-day average. Three invoices outstanding ($18,400 combined) — chase these first.
Flagged this week
Lead count 34% below 6-month average
WarningNo seasonal pattern explains this. Lead volume has been declining for 3 consecutive weeks.
Flagged this week
Gross margin hit 62% — highest in 8 months
PositiveThe contractor rate renegotiation in March is showing up. This is a meaningful improvement worth protecting.
Flagged this week
Most problems don't arrive suddenly.
They arrive quietly.
Lead volume starts dropping in week 3. Cash runway is shrinking slowly. A cost line has been creeping up for two months. These aren't crises yet — but they will be, if nobody notices.
Most business owners don't have the bandwidth to monitor 20 metrics every week. Frank does. And when something moves outside its normal range, he tells you — while there's still time to act.
Every metric. Every week.
Compared to what's normal for you.
Frank doesn't use industry benchmarks. He uses your own 6-month rolling history — so “normal” means normal for your business.
Rolling baseline
Frank calculates your 6-month rolling average and standard deviation for every metric he tracks — revenue, cash, margins, leads, sessions, and more.
Anomaly detection
Any week a metric moves 1.5 or more standard deviations from its baseline, Frank flags it. That threshold catches real movements without generating noise.
Memory check
Before surfacing an alert, Frank checks his memory. Is this a known seasonal pattern? A decision that explains the change? If so, he stays quiet.
Not every flag is a fire.
Frank knows the difference.
Severity is determined by how far the metric moved, how fast, and whether it affects cash or goals directly.
Needs attention now. Usually involves cash, runway, or a sharp unexpected decline in a core metric.
- Cash runway below 30 days
- Revenue down 30%+ with no known cause
- Largest client invoices 60+ days overdue
“You've got 28 days of runway. Three invoices outstanding for $18,400. Chase those first — that alone buys you another 3 weeks.”
Not urgent yet, but trending in the wrong direction. Worth watching closely this week.
- Lead volume declining 3 weeks running
- Margins compressing slowly
- Cost line growing faster than revenue
“Lead count is down 34% against your 6-month average. No seasonal pattern explains this. Worth looking at your top-of-funnel this week.”
Something is moving in the right direction, often more than usual. Frank surfaces wins too — not just problems.
- Margin hit a multi-month high
- Lead-to-customer conversion improving
- Revenue per client trending up
“Gross margin hit 62% — highest in 8 months. The contractor renegotiation is showing up. This is worth protecting when you next take on overhead.”
He checks his memory
before flagging anything.
Most alert systems surface everything that moves. Frank cross-references every anomaly against what he already knows about your business before deciding whether to flag it.
If you told Frank it's your slow season, he already knows. If you logged a decision that explains the movement, he's already seen it. You only hear about genuinely unexpected things.
What Frank stays quiet about
Revenue drops in August — you told Frank that's your slow month.
Payroll spike in March — Frank knows you hired in February.
Session drop in January — Frank logged this as normal post-holiday behaviour.
What Frank does flag
Sessions down 34% — no seasonal pattern, no known cause, happening in March.
Accounts receivable up 60% — no new big clients, nothing in memory explains this.

Stop finding out
when it's already expensive.
Frank watches your numbers while you run your business. Problems surface in week 3 — not month 6.
No credit card required