Connect your team's work
to your business numbers.
Frank connects to ClickUp to read task completion, project velocity, and team output — then connects that picture to your revenue, costs, and margins.
No credit card required
ClickUp + Frank
Connected
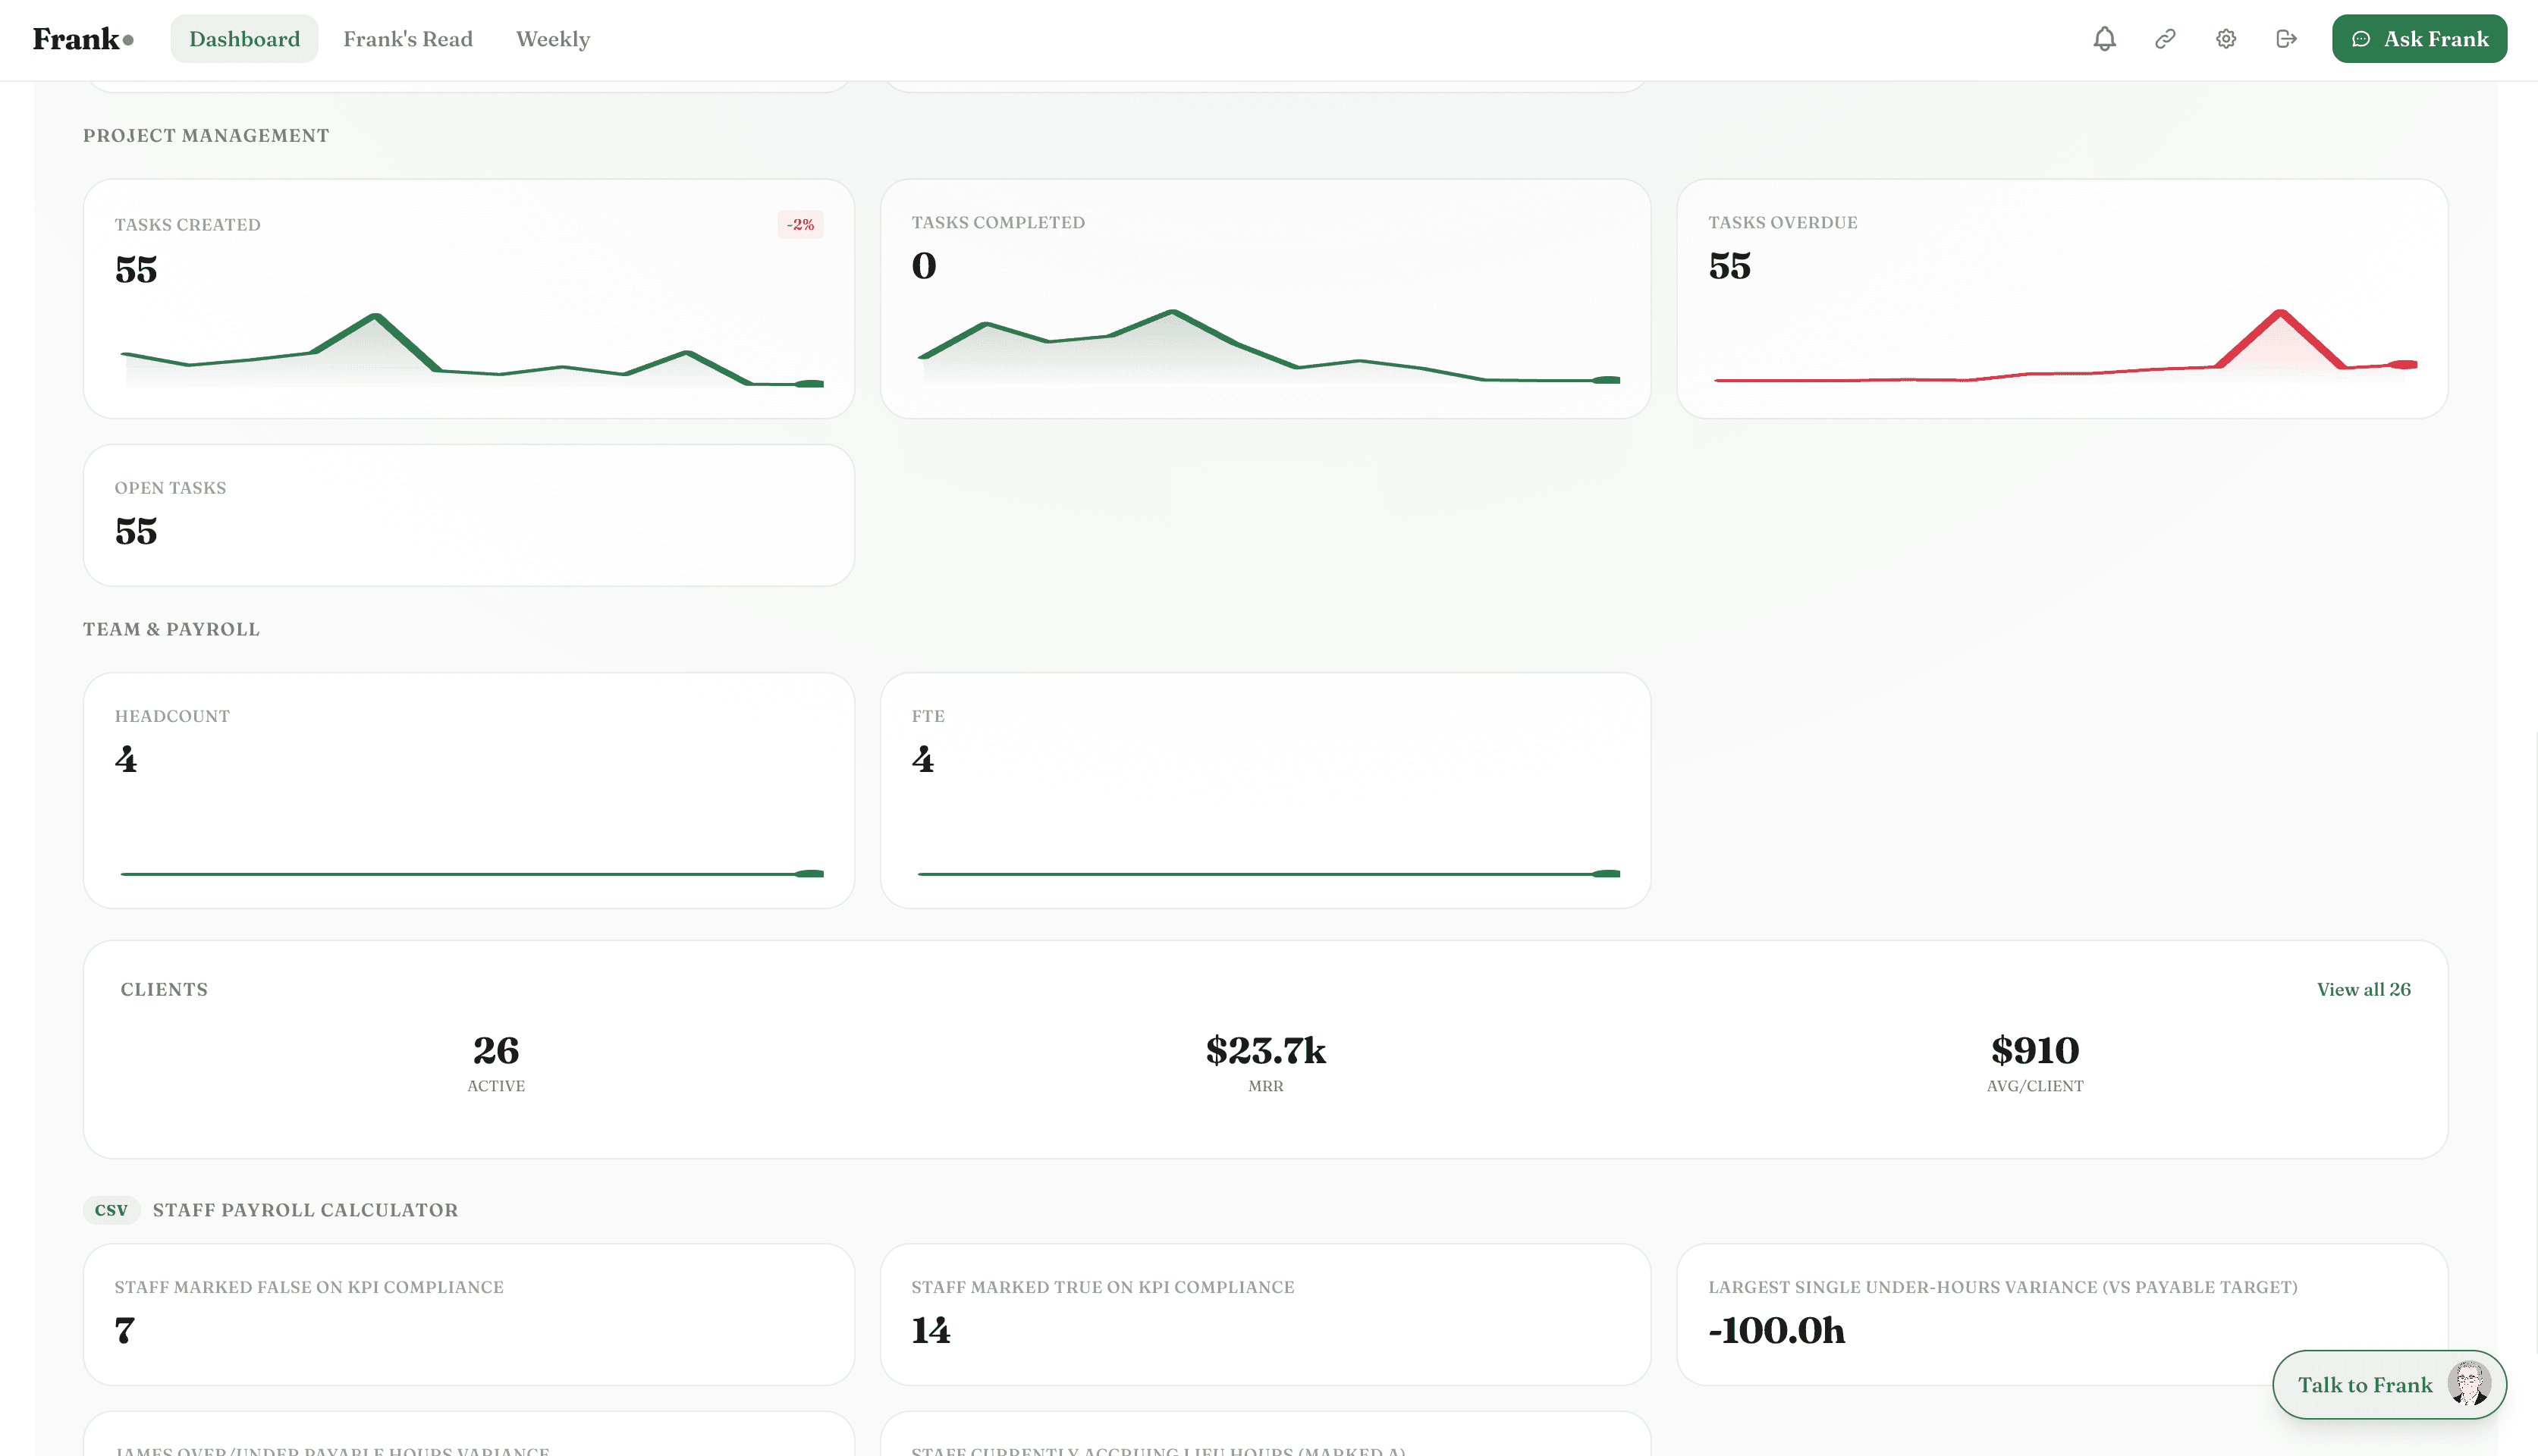
What Frank pulls from ClickUp
Frank reads your ClickUpdata automatically — no exports, no manual entry. Here's what he looks at.
Task completion rate
Percentage of tasks completed on time, by team and by project.
Project velocity
How fast projects move through your workflow — and where they stall.
Overdue tasks
Outstanding work past its due date — and the revenue or delivery risk it represents.
Team workload
Task distribution across team members — who's at capacity and who has room.
Project status
Active projects, their completion percentage, and whether they're running to schedule.
Sprint metrics
Velocity, completion rate, and carry-over rate across sprints or planning cycles.
What Frank does with your ClickUp data
Frank doesn't just display the numbers — he reads them, connects them to the rest of your business, and tells you what matters.
3 overdue projects. Combined invoicing impact: $24,000.
Frank connects ClickUp project status to your Xero invoicing and flags when overdue work is delaying billable milestones. Operational slippage has a direct cash flow cost — Frank quantifies it.
Task completion dropped from 95% to 78% in 3 weeks.
A sustained drop in completion rate usually signals capacity pressure before it shows up in revenue. Frank monitors the trend and flags it early — so you can act before a project backlog becomes a client problem.
Revenue per employee grew 18% while headcount grew 10%.
Frank tracks output efficiency over time. When revenue per person improves alongside growth, it's a sign that your team is scaling the right way. Frank surfaces this as a positive signal in your weekly briefing.
Connected in under 2 minutes.
One-click OAuth. No API keys, no CSV exports, no developer required.
Connect ClickUp
Click 'Connect ClickUp' in integrations. OAuth authentication — select the workspaces you want Frank to read.
Frank maps your projects
Frank reads task structure, completion data, and project status from your ClickUp workspace.
Get operational insights weekly
Your weekly briefing includes a team and project summary — connected to the broader business picture.
Also connects with

Your ClickUp data,
finally working for you.
Connect ClickUp in under 2 minutes. Frank starts reading your data immediately and delivers your first briefing within 24 hours.
No credit card required