Your finances,
finally legible.
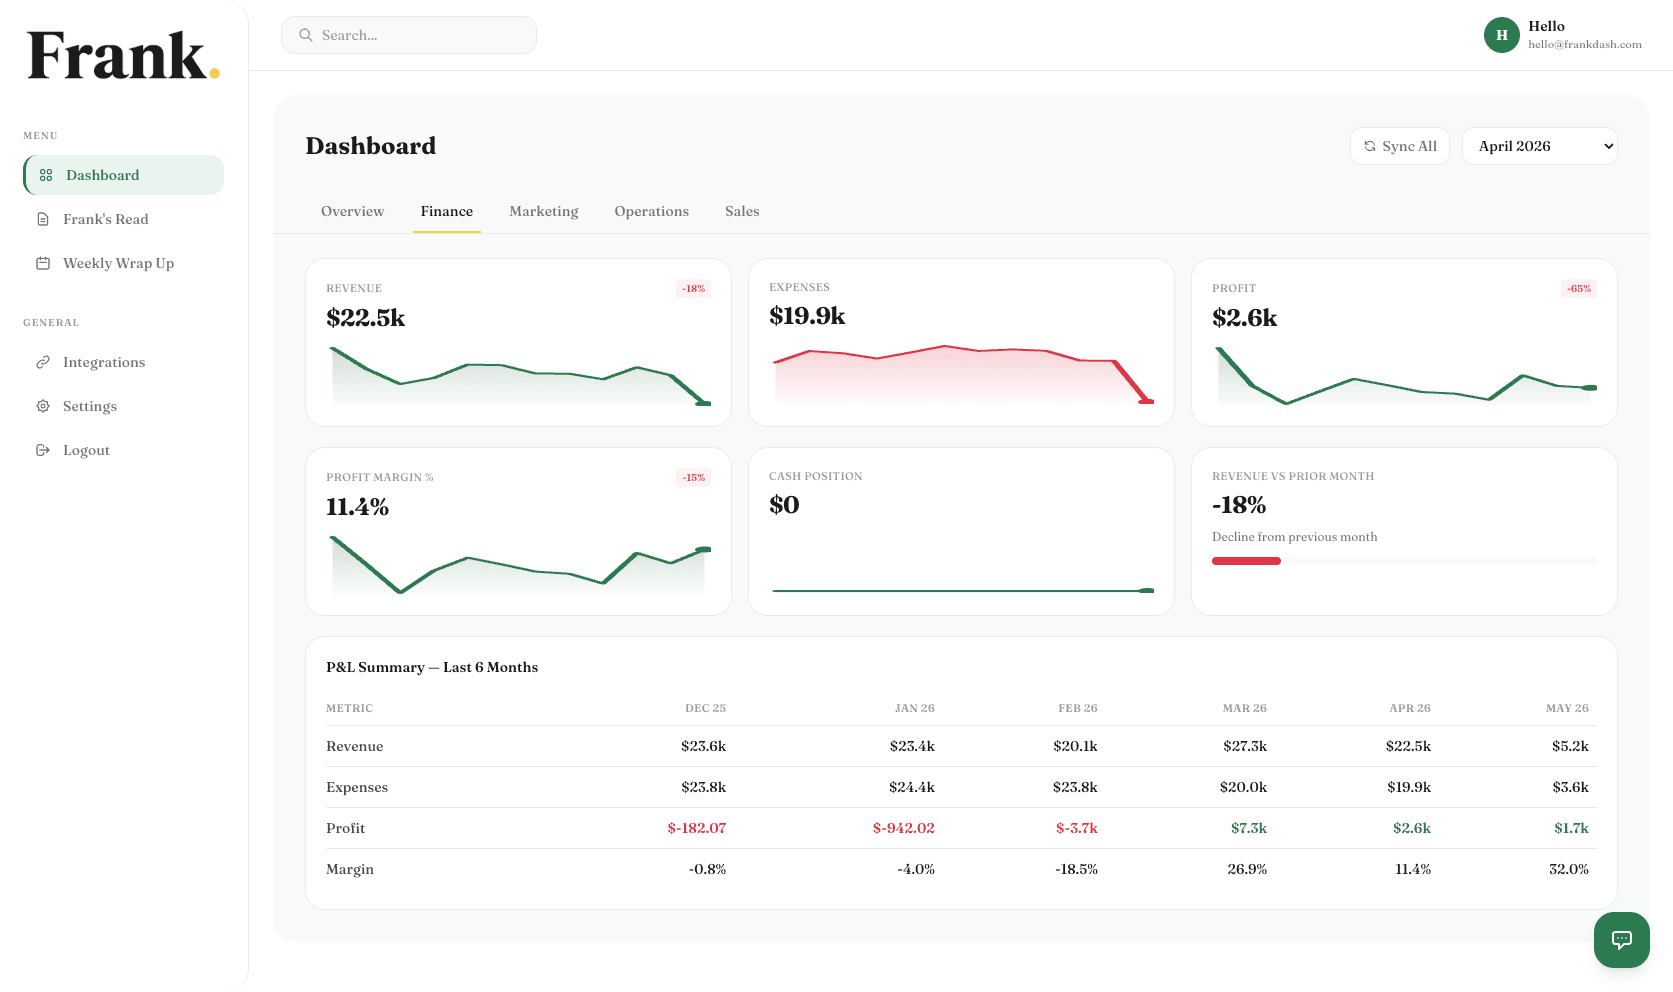
Revenue, expenses, cash position, and margins — connected and translated. Frank doesn't just display your financial data. He tells you what it means.
No credit card required
Xero shows you everything.
Making sense of it still falls on you.
The data is all there — but it's in accounting format. Line items, ledger codes, trial balances. Understanding what it means for your actual business still requires someone to translate it.
Frank pulls your financial data and presents it the way a business owner thinks about it — not the way an accountant does. Revenue trend. Margin movement. Cash position. Runway. All connected.
Four views. One complete picture.
Every number that matters to a business owner — not every number that exists in your accounting file.
Revenue
Monthly trend, year-on-year comparison, and breakdown by source
- Total revenue vs same period last year
- Monthly trend with 6-month chart
- Revenue by stream (if connected)
- Frank flags unusual spikes or drops
“Revenue was $42,300 last month — up $3,100 on February. The growth came from 3 new contracts signed in week 2.”
Expenses
Category breakdown, trending costs, and where spend is accelerating
- Expenses by category (payroll, contractors, software, etc.)
- Month-on-month movement per category
- Cost lines growing faster than revenue
- Frank highlights unusual increases
“Contractor costs jumped 28% in Q1 while revenue grew 11%. Worth renegotiating before you add more headcount.”
Cash position
Current balance, upcoming inflows and outflows, and runway
- Cash in bank as of today
- Invoices outstanding and due dates
- Upcoming payroll and fixed costs
- Runway at current burn rate
“$34,200 in the bank. Payroll is $9,200 on the 15th. After that you're at $43,500. Comfortable.”
Margins
Gross and net margin trend — the health signal most owners overlook
- Gross margin % and trend over time
- Net margin after all costs
- Month-on-month margin movement
- Frank flags compression before it compounds
“Margin dropped 4 points since you hired in March. Revenue grew 11%, payroll grew 19%. Growing — but getting more expensive.”
Revenue ≠ cash.
Frank knows the difference.
Most dashboards show you P&L figures. Frank understands that a healthy profit line and a stressed cash position can exist at the same time — and he never confuses the two.
Frank tracks what's actually in your bank, what's committed, and what's coming in — separately from what your P&L says. You always know both.
“P&L profit is $18,400 this month. But $34,000 in invoices are outstanding 45+ days. Your cash position is tighter than the profit line suggests. Chase the receivables this week.”
“Cash looks comfortable at $67,000. But gross margin has compressed from 58% to 49% in 6 months. Revenue is growing, but so is the cost to deliver it. Worth investigating before it gets worse.”
What Frank tracks for you
Connects to Xero, Stripe, and QuickBooks
One-click OAuth. Frank pulls your P&L, balance sheet, and cash data automatically. No manual exports, no spreadsheets.

Your books are talking.
Frank translates.
Connect Xero or Stripe once. Frank reads your financial data and puts it in plain English — updated every week.
No credit card required