Connect your ad spend
to actual revenue.
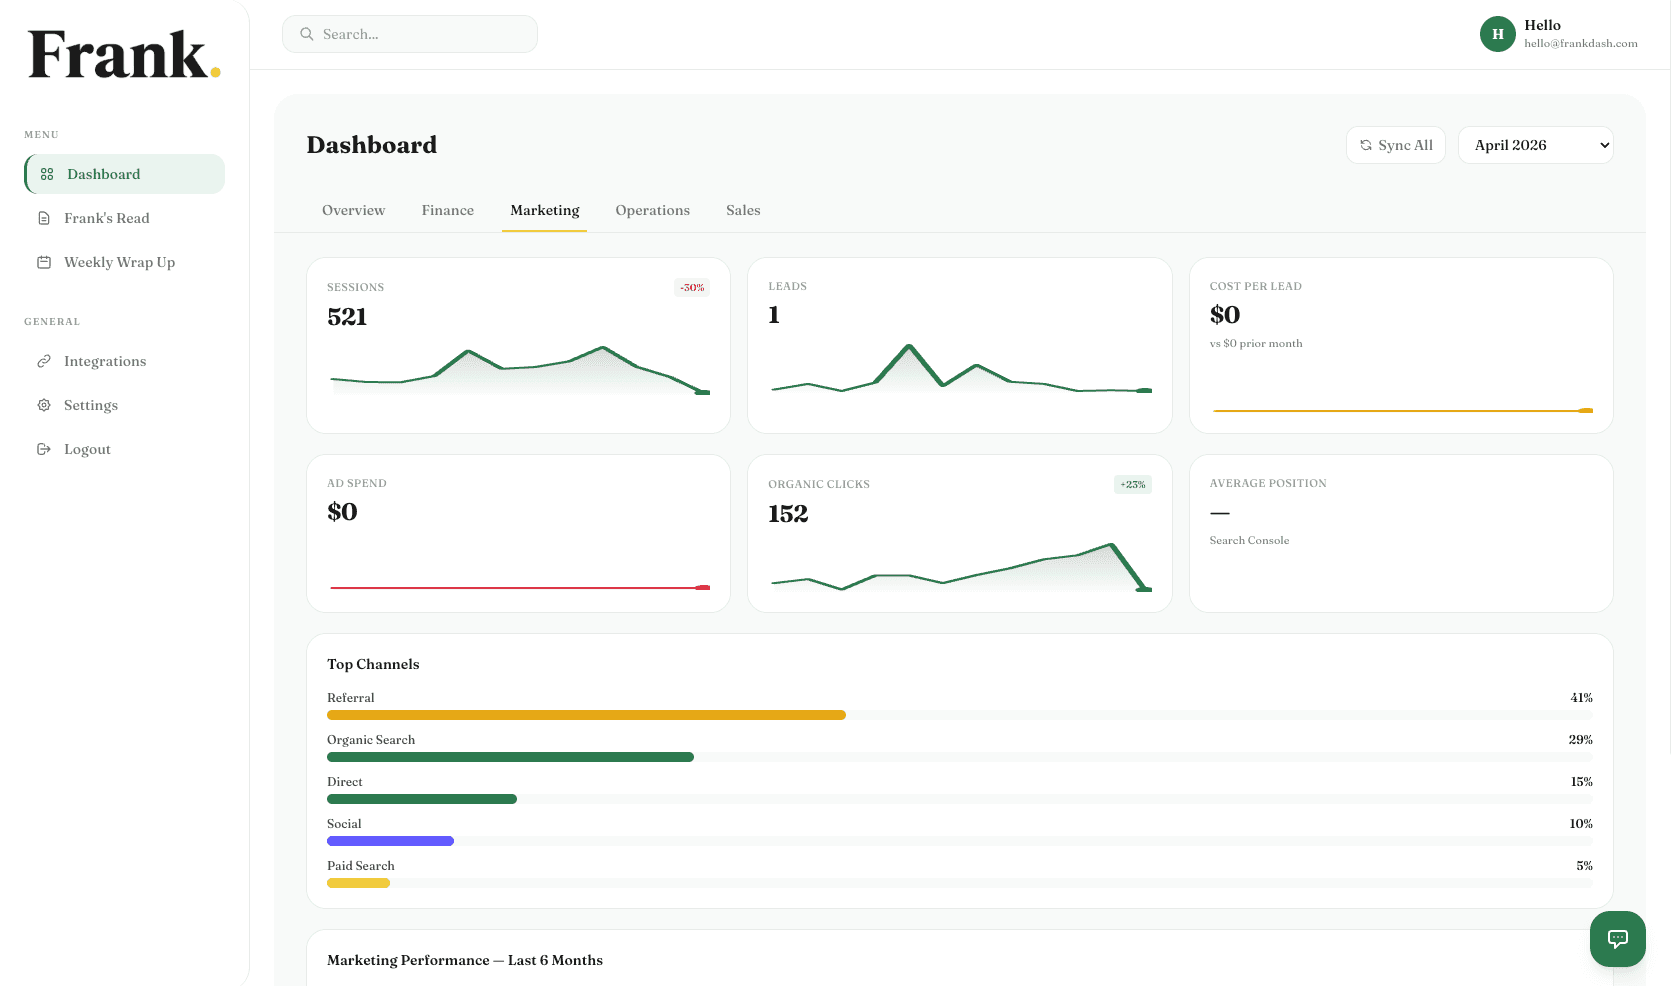
Sessions, leads, cost per lead, and ad spend — in one place. Frank reads the numbers across GA4 and Google Ads and tells you what's actually working and what's not.
No credit card required
You're spending on marketing.
But is it actually working?
Google Analytics tells you about sessions. Google Ads tells you about clicks. Your CRM tells you about leads. None of them tell you whether the money you're spending is generating revenue — because they don't talk to each other.
Frank pulls everything together. Sessions, leads, cost per lead, ad spend by channel, organic vs paid — in one dashboard. With Frank's read on what the numbers actually mean.
Every marketing number that matters.
None of the ones that don't.
Frank tracks the metrics that connect marketing spend to business outcomes — not vanity metrics.
Sessions & traffic
Total sessions, organic vs paid split, and week-on-week trend. Frank flags drops before they become revenue problems.
“Sessions down 18% on last month. The paid drop matches your ad spend cut. Organic is holding — that's the signal worth watching.”
Leads
Lead count, source breakdown, and lead-to-conversion rate. Frank identifies which channels are actually producing.
“34 leads this month at 18% conversion. Down from 29% last quarter. The volume is fine — the conversion rate is the problem.”
Cost per lead
How much each lead costs by channel. Frank cross-references with revenue to tell you which spend is worth it.
“$71 per lead from Google Ads. 6 converted in 60 days. $400 per customer acquired. Depends entirely on your average contract value.”
Ad spend breakdown
Spend by campaign and channel. Frank watches for budget drift and campaigns that are spending without performing.
“Google Ads budget is $2,400/month. Brand campaigns converting at 4.2%. Non-brand at 0.8%. Worth shifting budget toward brand.”
Organic vs paid
The split between free and paid traffic over time. Frank flags when paid is propping up a declining organic base.
“Organic share dropped from 62% to 44% in 6 months. Paid is filling the gap but at a cost. Your organic SEO needs attention.”
Session trends
6-month rolling trend so you can see whether growth is real or seasonal. Frank distinguishes the two.
“January spike looks impressive but matches last year's pattern exactly. This is seasonal, not growth. Don't base hiring decisions on it.”
Marketing data
connected to your
financial numbers.
Frank doesn't treat your marketing data as separate from your business data. He reads both together — so when your revenue dips, he checks whether lead volume explains it. When your leads are up, he checks whether revenue followed.
Most tools tell you what happened in one channel. Frank tells you what it means for the whole business.
Frank's marketing read
Connecting the dots across your marketing data
Sessions dropped 18%
Google AnalyticsMatches the paid ad spend cut in week 2. Organic held flat — the organic base is healthy.
Revenue held at $24k
Stripe + XeroRevenue held despite fewer sessions. Your conversion rate from organic is better than paid was.
Cost per lead: $71
Google AdsBefore the cut it was $94. The campaigns you kept are your better-performing ones.
Frank's take
Cutting paid spend was the right call. Revenue held and cost per lead improved. The question now is whether organic can sustain this if you want to grow volume.
Connects to Google Analytics 4 and Google Ads
One-click OAuth. Frank pulls sessions, conversions, and ad spend automatically — updated weekly.

Stop guessing
what your marketing is doing.
Connect GA4 and Google Ads once. Frank connects your spend to your revenue and tells you what's worth keeping.
No credit card required